Find your way around the board
A quick tour of the main board areas and controls.
This article gives you a quick tour of the board so the main controls feel familiar before you start changing anything.
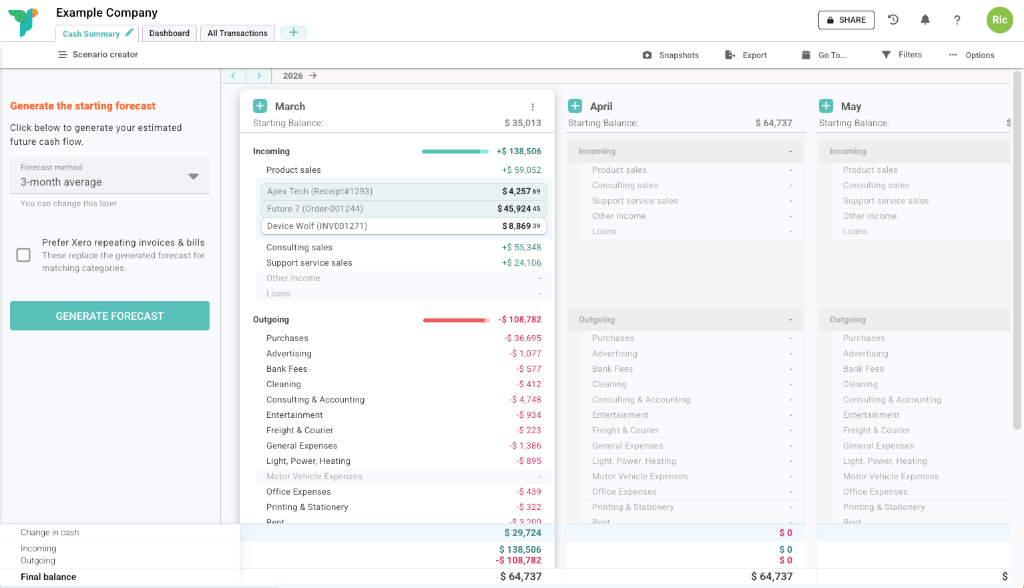
After you create or import an organisation, Budgee opens the Cash Summary tab first.
Time periods
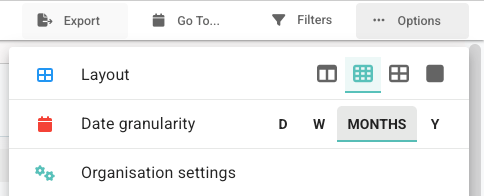
Transactions are grouped into time columns. By default, each column is a month. You can switch the board to years, weeks, or days from Options.
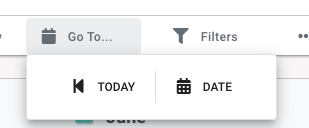
Use the bottom scroll bar to look further into the future. To move into the past, click Back. Keep clicking Back to go further back.
You can also click Go To... in the header to jump straight to a specific date.
The current time period is in a box with a shadow so you can find it easily.
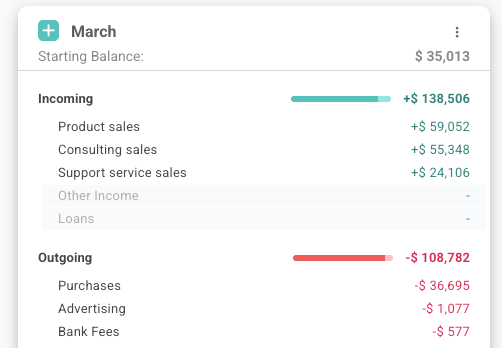
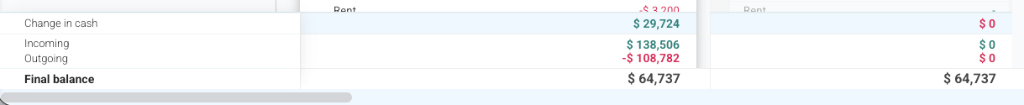
Cash summary tab
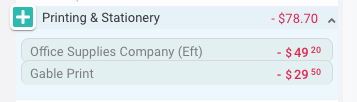
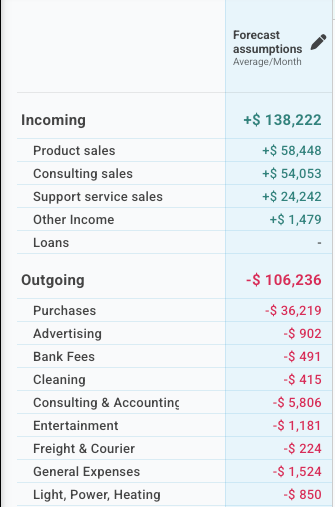
The Cash Summary tab groups transactions into Incoming, Outgoing, and Transfers. Those groups are then split by category so you can see what changed during each period. Categories are the cash flow groupings Budgee uses to organise related transactions.
Click a category to open it and see the transactions that make it up.
Click an individual transaction to see more detail.
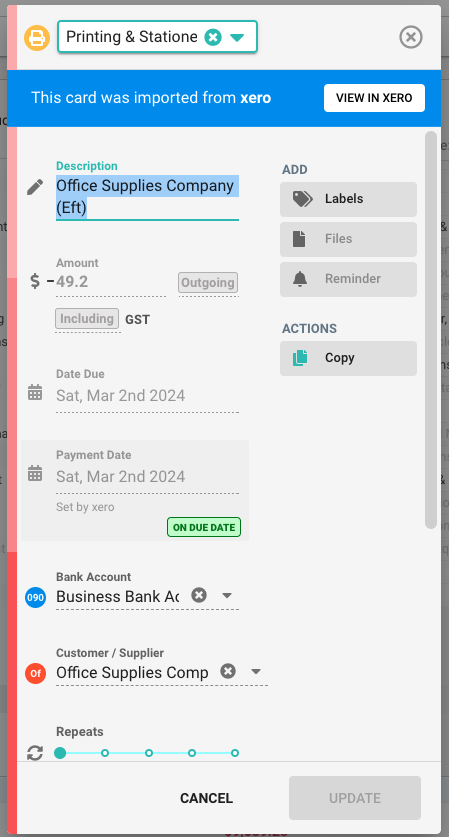
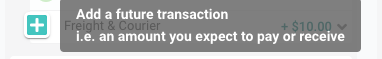
Paid transactions are locked in place. If a transaction has not been paid yet, you can change its dates or drag it to when you expect the money to move. You can also add your own forecast transactions with the + button.
Balance footers
The footer in Budgee is where the balances and totals for the time period are.
You can choose which footer totals are visible. Hover over the footer labels on the left, then click the footer settings button when it appears. 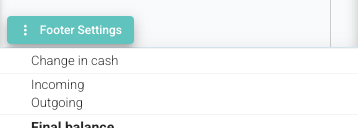
This opens the footer options box, where you can choose which totals to show and how you want them displayed.
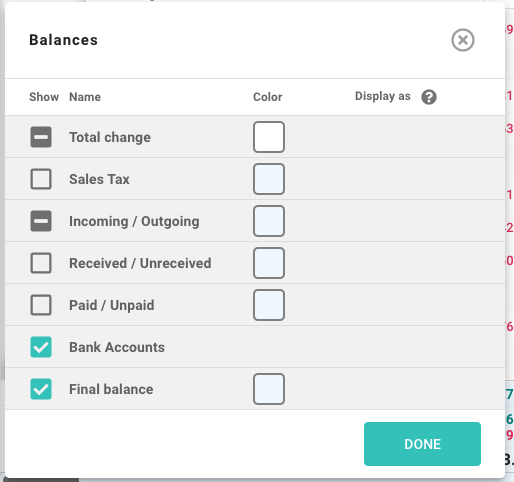
Footer visibility can also be set per tab. Learn more about tab footer options.
Learn more about footer totals.
Automatic forecasting
When you start a new organisation, you will see the forecasting tool. Click Generate forecast to create your first forecast from your history. The first version does not need to be perfect; you can change the forecast method later.
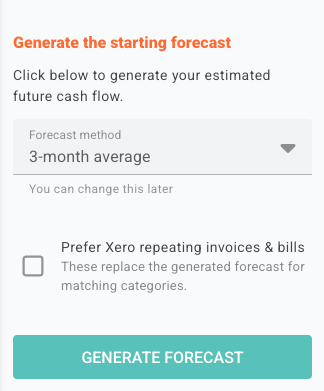
Once generated, the forecasting tool shows your forecast assumptions. Click any assumption to see how it was created and change it to a different method or a custom amount.
Learn more about automatic forecasting.
Scenarios
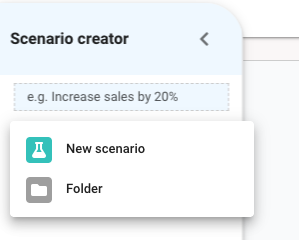
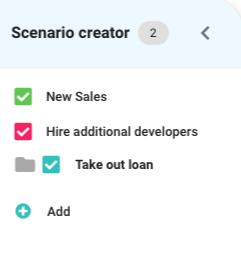
Once you are happy with your forecast, you can use Budgee scenarios to test possible changes before you make decisions.
Click the scenario creator button in the header to open the scenario drawer. Then click Add and choose the scenario you want to create.
Learn more about scenarios. Once you have set them up, you can turn them on and off in the scenario creator drawer.
Tabs
Tabs give you different ways to view the same organisation data. You can keep the default tabs, edit them, or create new tabs for the views you use most.
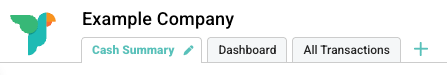
Try opening Dashboard and All Transactions, or add a new tab when you want a view for a specific purpose. Learn more about tabs and views.