Automatic forecasting
Build a forecast from past activity, then review and adjust it.
Budgee’s forecasting tools help you turn historical cash flow into an editable future forecast.
They are designed to help you:
- Generate an initial forecast from past activity
- Review forecasted amounts at different levels
- Adjust forecast assumptions
- Drill into the transactions behind the numbers
Before you start
The forecasting tool appears on the Cash Summary and Contact tabs.
1. Generate your first forecast
If forecasting has not been set up yet, you will see the setup widget. For your first forecast, it is fine to choose any method. You can change it later.
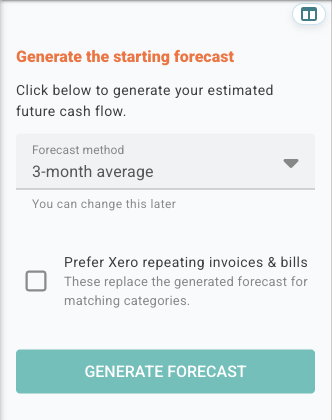
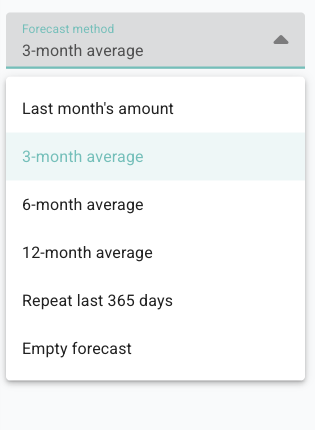
Forecast method
This sets the starting rule Budgee uses to estimate future monthly amounts. You can change this later for the whole forecast or for smaller parts of it.
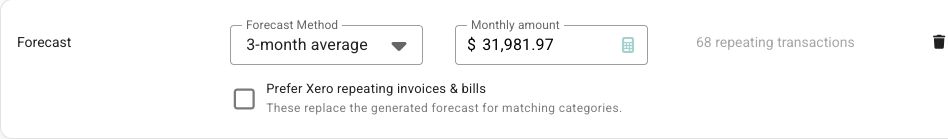
Prefer Xero repeating invoices & bills
Turn this on if you want Budgee to use matching Xero repeating invoices or bills wherever they exist, instead of generating a repeat pattern itself.
Important: when Budgee uses Xero repeating items for a category, those items become the forecast for that category. Budgee does not also create a history-based forecast for the same category. Turn this on when the repeating invoices or bills represent the full expected cash flow for that category.
2. Using the forecasting tool
Once forecasting is active, the forecasting tool shows the main parts of your forecast in one place.
At the top, you will see Forecast assumptions (mth ave). Click the pencil icon beside it to open the full forecast dialog.
Below that, each row shows the aggregated monthly average for everything inside that branch of the forecast.
The monthly average helps you understand the size of that part of the forecast. Budgee takes the forecast payments for the year and divides them by 12 months. It does not mean the same amount will be paid or received every month.
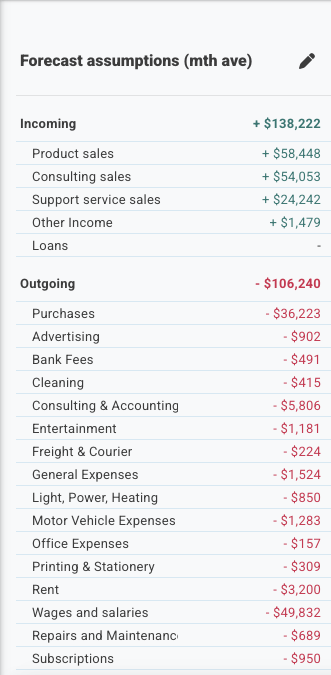
The totals near the top of the sidebar help you compare broad forecast areas before opening a category or contact. Categories are the cash flow groupings Budgee uses to organise related transactions.

3. Use the forecast dialog
The forecast dialog is the main place for reviewing and editing the forecast.
When it opens, work from the top down:
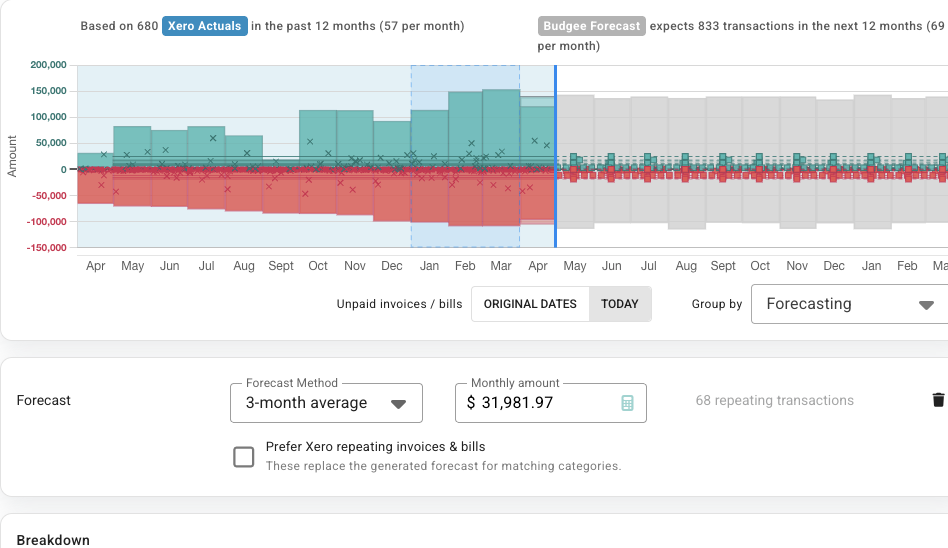
- Top comparison: shows how many past transactions Budgee used and how many future forecast transactions it created.
- Chart: shows the past year on the left and the forecast year on the right, so you can check whether the future pattern looks reasonable.
- Forecast settings: let you change the forecast method, adjust the monthly amount, or choose whether to use Xero repeating invoices and bills.
- Breakdown: shows the categories or contacts that make up the forecast. Select a row to review the forecast for that category or contact.
Forecast options
Forecast options are advanced settings inside a forecast row or section. Most users should leave the standard defaults in place.
These options control how Budgee creates generated forecast items and how it avoids double-counting known future items.
Budgee creates generated forecasts from past activity. If there are already known future items, such as imported invoices, bills, payments, or receipts, Budgee can reduce the generated forecast by those items so they replace the forecast instead of sitting on top of it.
Forecasts are subtracted from by selected known future items. This happens when a forecast is created, when you press Recalculate, or when an accounting import is applied.
Default settings
The default settings are the safest choice for most forecasts.
| Option | Default |
|---|---|
| Imported payments, receipts, invoices, and bills | Included |
| Draft invoices and draft bills | Included |
| Manual future items | Not included |
| Scenario items | Not included |
| Current-month forecast start | Start of this month |
| No clear repeat pattern | Place the monthly average on day 15 |
Known future items
Known future items include payments, receipts, invoices, bills, draft invoices, and draft bills from the connected accounting source.
Imported payments, receipts, invoices, bills, draft invoices, and draft bills are included by default because they usually represent real upcoming cash movement that is already known.
Manual and scenario items
Manual future items and scenario items are off by default. They are only used when you press Recalculate, and only if you turn them on in Forecast options.
Adding a manual item or turning a scenario on does not automatically recalculate the forecast. This avoids surprises when planning items or scenario toggles would otherwise rewrite generated forecasts.
Forecast starts this month
This setting controls where generated forecast items begin.
| Option | What it does |
|---|---|
| Start of this month | Includes generated forecast items from the first day of the current month. Items before today may appear overdue. |
| Today | Starts generated forecast items from today. |
| Next month | Skips generated forecast items for the current month. |
Start of this month is the default. For Repeat each transaction, Budgee also looks back far enough to include matching items from earlier in the current month last year, so current-month forecasts are not accidentally missed.
No repeat pattern found
When Budgee cannot find a clear repeat pattern, it creates one generated item each month using the monthly average. Forecast options let you choose the day of the month for that item.
The default is day 15. If the selected day does not exist in a shorter month, Budgee uses the last day of that month.
Before you press Recalculate: Recalculate will rebuild the generated forecast for this section using these settings. Items you have manually changed should be checked afterwards.
Example: draft invoices are doubled up
Budgee can subtract imported draft invoices from generated forecasts so the draft invoice replaces the forecast amount instead of sitting on top of it. This is on by default. Open Forecast options, check that draft invoices and bills are selected, then press Recalculate.
4. Use the forecast graph
The graph combines 12 months of historical actuals and 12 months of future forecast items in one view.
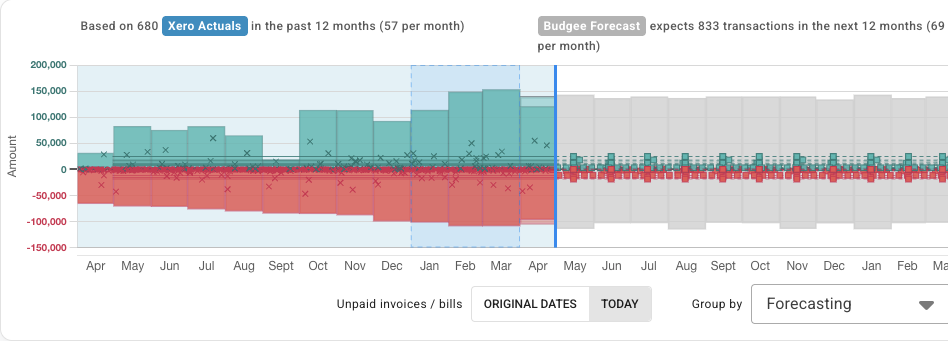
The left side shows activity imported from Xero. Each x is one paid actual transaction. Budgee adds the transactions for each month together to create the monthly bars, so you can quickly see how much came in and went out. Click a month bar when you want to see the transactions behind that month.
The right side shows Budgee’s forecast. The grey bars show the total monthly forecast shape. Each square is a forecast transaction. If you see more than one square in a month, that month has more than one forecast transaction.
What the colours mean
- Teal bars and x markers: paid incoming actuals from Xero.
- Red bars and x markers: paid outgoing actuals from Xero.
- Light teal bars: incoming invoices imported from Xero that have not been paid yet.
- Light red bars: outgoing bills imported from Xero that have not been paid yet.
- Light grey bars: Budgee’s future monthly forecast totals.
- Teal squares: forecast money coming in.
- Red squares: forecast money going out.
Unpaid invoices / bills toggle
| Option | What it does |
|---|---|
| Original dates | Keeps unpaid actuals on their original dates |
| Today | Moves unpaid actuals onto today for easier visibility |
5. Edit the forecast assumptions table
The assumptions table is where most forecast editing happens. Use it to change the amount, choose a different forecast method, delete a generated forecast, or start again with your own custom forecast rows.
Change the monthly amount
Changing the Monthly amount changes the size of the forecast for the row you are viewing. Where Budgee can, it keeps the same split between the items underneath.
For example, a sales forecast might be split between three customers. If Customer A makes up half of the forecast and Customers B and C make up the other half, increasing the monthly amount will increase each customer’s forecast in roughly the same proportions.
Quick percentage change: you can add a multiplier to the monthly amount and press Enter. If the monthly amount is $1,000 and you expect it to be 10% higher, type *1.1 at the end. To reduce it by 10%, type *0.9.
Budgee updates the forecast and keeps the same proportions between the items underneath, including forecasts built with Repeat last 365 days.
Choose a forecast method
Choosing a forecast method again resets that row back to a forecast based on historical data. Use this when you want Budgee to recalculate the forecast from past activity instead of keeping your manual edits.
The Prefer Xero repeating invoices & bills checkbox only appears at the top level of the forecast. If you want to use Xero repeating invoices or bills for a lower-level row, select Use imported repeats from that row’s forecast method instead.
Delete and add your own rows
The bin removes the forecast rows for the area you are viewing. After deleting them, you can add your own custom forecast rows instead of using the generated ones.
If your business does not have many repeat customers, Budgee’s history-based forecast may not be the best starting point for forecasting incoming items like sales. Roofing, building, and project-based businesses often work this way. In that case, you may want to delete the generated forecast and add your own expected jobs or customer payments.
6. Use the breakdown table
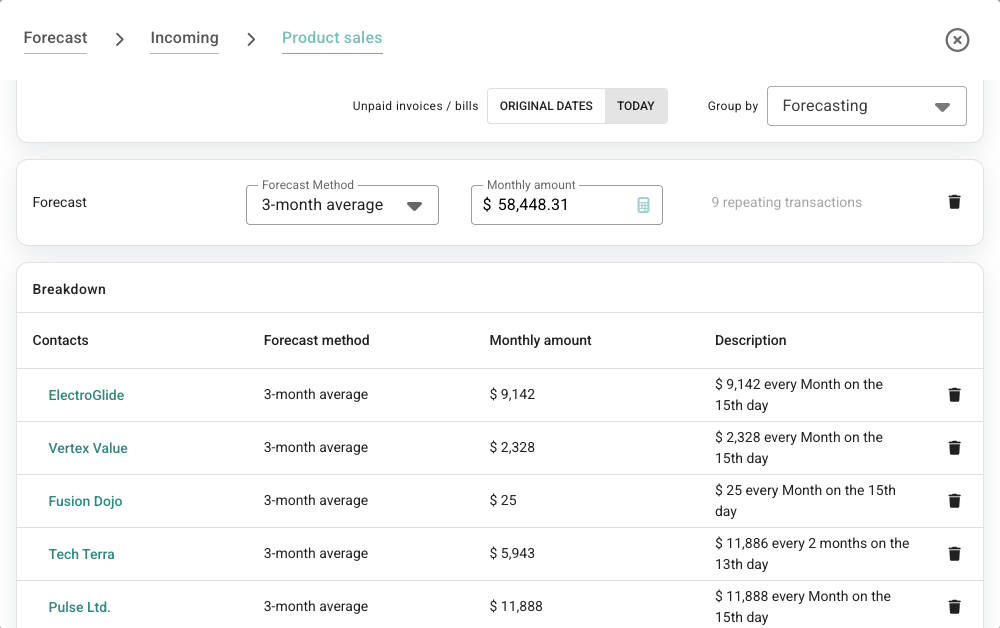
Scroll down to the breakdown table when you want to see what makes up the forecast you are viewing. Each row is a smaller part of the forecast. Select a row to open that part and review its own method, monthly amount, and forecast rows.
On the Cash Summary tab, Budgee usually starts with incoming and outgoing, then categories, then contacts. For example, if you open Incoming and then Product sales, the breakdown shows the contacts that make up Product sales.
How changes move through the forecast
The breakdown rows are connected to the total above them. If you change the monthly amount at the top, Budgee spreads that change through the rows underneath in the same proportions where it can.
Changes also move back up. If you change the monthly amount for a contact or category in the breakdown table, the total monthly amount above it updates as well.
Changing the forecast method at the top is a larger reset. Budgee applies the selected method to everything underneath and replaces the existing forecast assumptions for that part of the forecast.
On the Contact tab, the order is usually reversed: open a contact to see the categories that make up that contact’s forecast. Use the path at the top of the dialog, such as Forecast → Incoming → Product sales, to see where you are and move back up.
If there are items that do not yet have forecast assumptions, use Add row at the bottom to add them yourself.
Refresh stale forecast methods
Forecast methods based on recent actual months can become stale after new accounting data is imported.
When Budgee can refresh a stale method, the forecast method control can show an Update to most recent months refresh action.
- Open the forecast table or navigator row you want to review.
- Look for the refresh icon beside the forecast method.
- Click Update to most recent months.
- Review the monthly amount and generated forecast rows after Budgee recalculates the method.
Refresh keeps the same kind of method, such as Last month, 3-month average, 6-month average, or 12-month average, but recalculates it from the latest relevant actual months.
Add missing forecast rows
Some rows may have transaction history or a planning need but no active forecast assumption yet.
- Open the forecast table for the area you are reviewing.
- Scroll to the bottom of the table.
- Click Add for the destination type, such as category or contact.
- Choose the missing row from the selector.
- Choose a forecast method or enter a monthly amount.
- Click Add.
This is useful when you do not want to create assumptions somewhere else first. You can add the missing row directly from the forecast table you are already reviewing.
Remove or archive forecast assumptions
Use the remove control on a forecast row when that assumption should no longer drive the forecast.
Budgee removes the active forecast method for that row and archives the related generated assumption data where needed, so the old method is no longer part of the active forecast.
Removing a forecast assumption is different from deleting an imported actual transaction. It retires the planning assumption while keeping the surrounding board history intact.
Roll customer forecasts up to a category
Some organisations start with detailed customer-level forecasts, then later need a simpler category-level forecast.
In customer-level forecast workflows, use Roll up customers when you want Budgee to combine the active customer forecasts into one category-level forecast.
Budgee preserves the overall forecast intent by using the customer forecasts to create a parent forecast. Customer-level assumptions are retired so the category can be managed more simply going forward.
Repeat forecast options
Repeat-based methods are useful when past activity should be projected into the future with a similar timing pattern.
| Repeat option | What it is for |
|---|---|
| Repeat last 12 months as transactions | Repeats the individual transaction pattern from the last year. |
| Repeat last 12 months as weekly totals | Uses weekly-style totals when individual transactions are less useful than the weekly pattern. |
| Repeat last 12 months as monthly totals | Uses monthly-style totals when the monthly amount matters more than individual transaction timing. |
| Use imported repeats | Uses matching repeating invoices or bills from the connected accounting system where available. |
If a method is disabled, Budgee could not find usable transactions in that method's date range.
Forecasting reference
Forecast methods
| Method | What it means |
|---|---|
| Last month’s amount | Uses paid actuals from the immediate last month |
| 3/6/12-month average | Converts recent historical ranges into a monthly average |
| Repeat last 12 months / Repeat last 365 days | Preserves yearly patterns and seasonality. The repeat can be based on transactions, weekly totals, or monthly totals. |
| Use imported repeats | Uses matching Xero repeating invoices or bills |
| Custom | Uses a manually entered monthly amount |
Practical tips
- Start broad: Adjust top-level rows first, then drill deeper only where needed.
- Seasonality: Use Repeat last 365 days to preserve yearly patterns.
- Targets: Use custom amounts when you want a specific target rather than a history-based estimate.