Budgee basics
A simple guide to the ideas you will use most in Budgee.
If Budgee feels like a lot at first, this page is for you.
You do not need to learn every setting before you begin. Budgee helps you bring your real cash activity into one board, build a forecast, and test decisions without changing your real records.
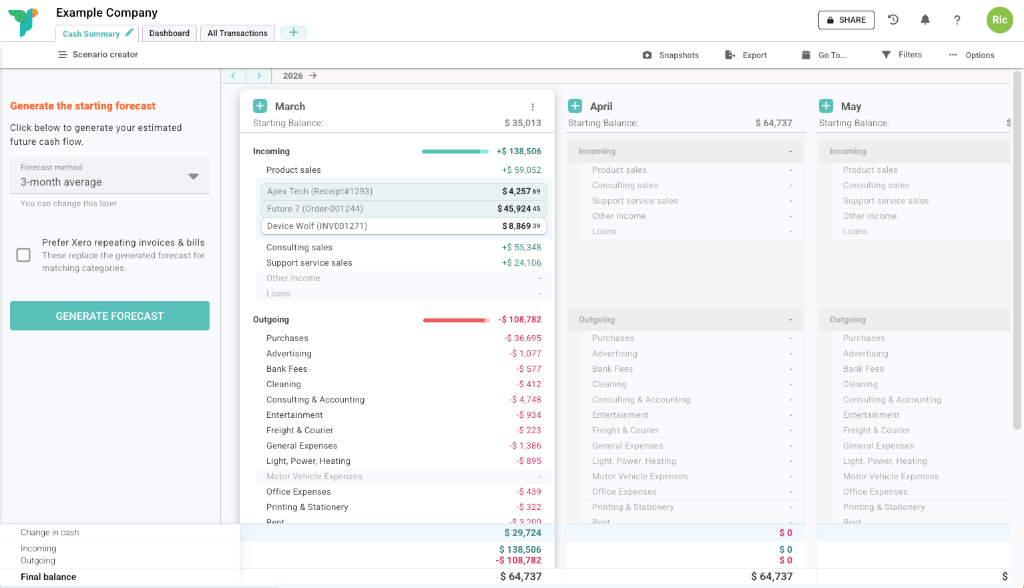
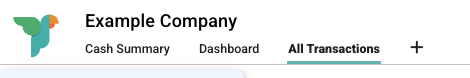
The board
The board is your main workspace for one organisation. It shows cash activity over time, usually in monthly columns.
Most work starts from one of these views:
- Cash summary: a grouped view of money in, money out, and transfers.
- Dashboard: summary charts, metrics, and reporting widgets.
- All transactions: a flatter view that is useful when you need to inspect or find specific items.
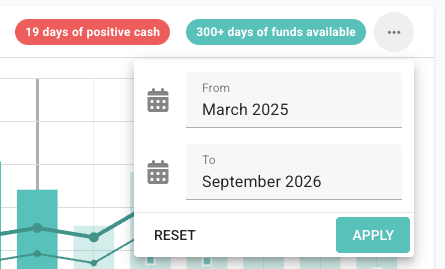
Time periods
Budgee organises the board into time periods. A period might be a month, week, day, or year, depending on the time view you choose.
The current period is where live work often happens. Future periods are where forecasts, unpaid items, scenarios, and expected dates become useful.
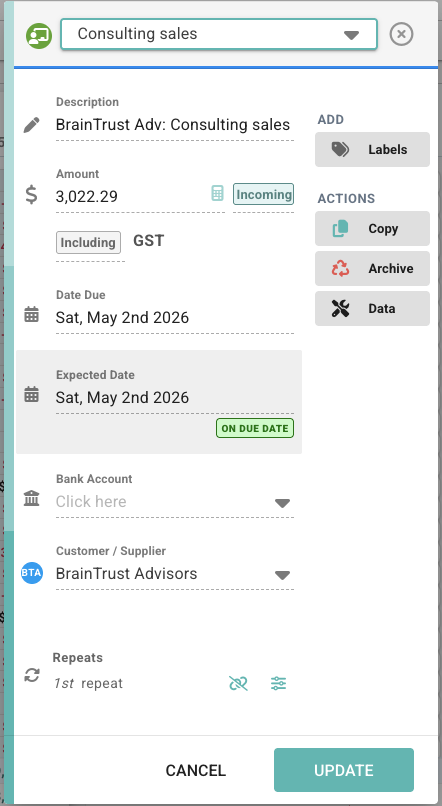
Transactions
A transaction is money coming in, going out, or moving between accounts. It might come from your accounting software, a forecast, a manual entry, or a scenario.
| Term | Meaning |
|---|---|
| Actual | A real item from your accounting data, or one that has been marked paid or received. |
| Forecast | A planned future item based on your forecast settings. |
| Draft | An item you have added while you are still planning. |
| Repeating series | A saved rule that creates future items on a schedule. |
Categories
Categories are the cash flow groupings Budgee uses to organise transactions, forecasts, and scenarios. They help you see what money is for, such as sales, rent, wages, subscriptions, or tax.
If you connect accounting software, categories usually come from your chart of accounts. You do not need to think about the full chart of accounts while using Budgee. In most places, choose the category that best describes the transaction or forecast item.
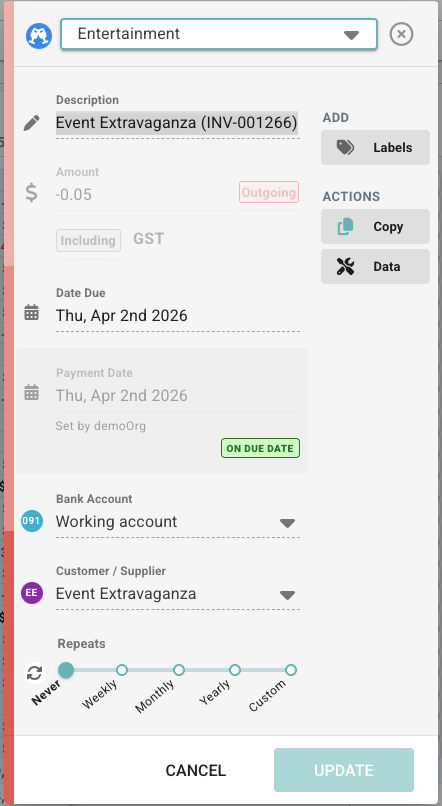
Due dates, expected dates, and payment dates
Dates are a major part of cash flow. Budgee separates dates so you can see both what was agreed and what you expect to happen.
- Due date: when the transaction is officially due.
- Expected date: when you expect the money to move.
- Payment date: when it was actually paid or received.
If a transaction is unpaid, moving its expected date is often the most useful way to keep the forecast realistic without rewriting history. Paid or received transactions also show the payment date, so you can compare what was due with what actually happened.
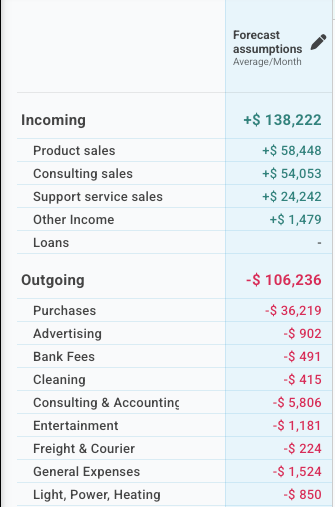
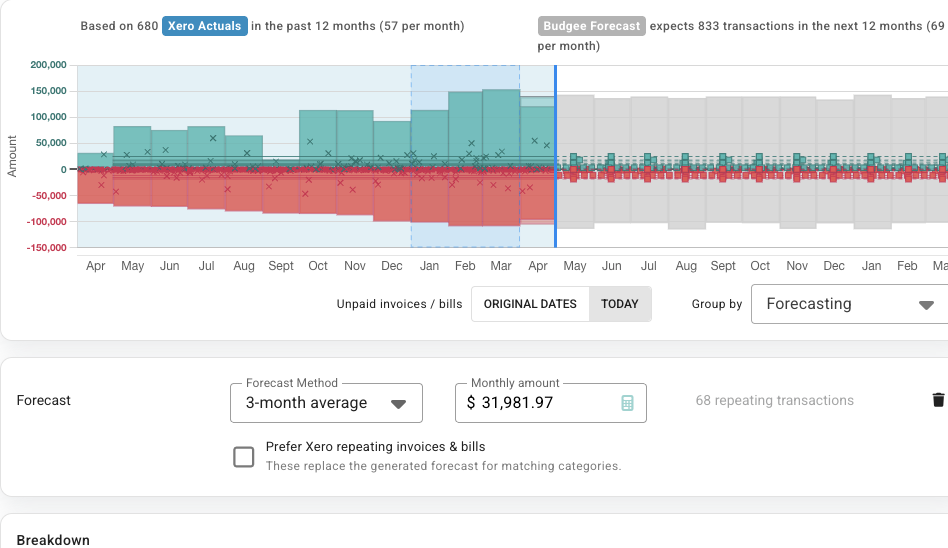
Forecasts
A forecast is Budgee's estimate of future cash flow. It can be based on past activity, imported repeating invoices or bills, or amounts you set yourself.
Your first forecast does not need to be perfect. Start with the big incoming and outgoing areas, then adjust anything that clearly needs attention.
Tabs
Tabs are saved ways of looking at the same organisation. They do not create separate copies of the data. They control what you see and how it is grouped.
This means one board can have a simple cash summary, a dashboard, an all transactions view, and custom views for specific clients, teams, or reporting needs.
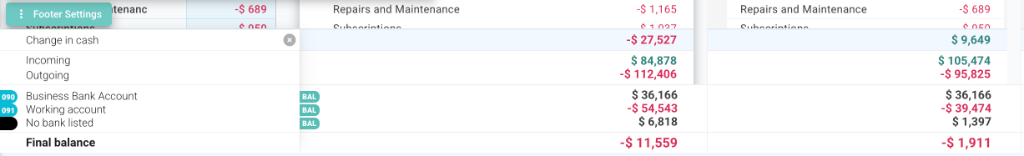
Footers
Footers are the totals at the bottom of transaction views. They help you understand the net change, incoming and outgoing totals, bank balances, available funds, and other summary rows for each time period.
Footer visibility can be controlled by tab defaults and by your own live footer settings.
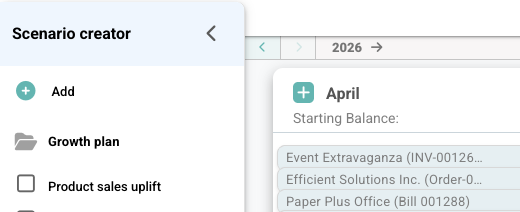
Scenarios
Scenarios let you ask what could happen. You can test changes such as delayed payments, higher sales, lower costs, new hires, or one-off purchases without changing your real transactions.
Active scenarios follow you across tabs, so the same what-if question can be reviewed in the cash summary, dashboard, and other views.
A simple way to start
- Create or connect your organisation.
- Open the Cash summary tab and understand the main incoming and outgoing groups.
- Create your first forecast.
- Review the Dashboard to check the headline numbers.
- Try one small scenario and turn it on and off.
That is enough to understand the basics: real activity, forecasts, helpful views, and possible changes.